
The theme for trucking—and pretty much all sectors in logistics or transportation—has been the same for the last couple of years. This theme being the high demand for these industries to move our nation’s freight volumes.
With great volumes comes the propensity for stifling congestion and related bottlenecks. Whether you look at trucking, rail, ocean, or barge. Every mode has had its woes at one point or another.
For today’s blog, we invite you to travel back in time with our experts at Commerce Express Inc. as we go over 2020 data that evaluated major freight highway bottlenecks and congested corridors for trucking.
FHA analyzed which stretches of interstates were the most congested
For starters, highways are the arteries for American commerce. Our countless roadways and interstates allow for trucks key lanes to travel from their origins to their destinations. Given the surplus of trucks on the road thanks to high demand the last two years, certain interstates were susceptible to significant congestion and bottlenecks.
The folks over at the Federal Highway Administration (FHA), an agency apart of the U.S. DOT, tracked in 2020 which particular stretches of interstates had it the worst. The federal agency based their conclusions off Annual Truck Hours of Delay per Mile.
What’s an Annual Truck Hours of Delay per Mile?
Well, it’s a metric calculated for each stretch, or segment, of an interstate using the following information attached with the data report:
- Delay is calculated for each 15-minute time period as the difference between actual travel time and reference travel time. Reference travel time is based on 85th percentile speed during off-peak and overnight time periods.
- Delay for each 15-minute time period is multiplied by 15-minute truck volumes. Truck volumes are estimated from Annual Average Daily Truck Traffic (AADTT) using typical time-of-day traffic volume profiles. Delay for each 15-minute time period is aggregated to get annual truck hours of delay.
- The total truck hours of delay is then divided by the segment length to get total truck hours of delay per mile, allowing for the comparison of all roadway sections across the NHS.
Yep, that’s a long-winded description. We assure you that those are the FHA’s words and not ours. The process of gathering all of this data and determining which particular stretches of interstate were the most congested was clearly a complex undertaking.
The final report of the data includes specific indexes that measure variables from travel time to travel reliability. The overall rankings considered the totality of all these intricate stats.
For simplicity’s sake, we will go over basics, but please check out the FHA’s analysis if you’re a stat nerd with a few hours to kill.
Where was the congestion?
Our experts at Commerce Express Inc. couldn’t help but hum Frank Sinatra’s “New York, New York” when looking over the final rankings. Of the top five spots, four of them were in the New York-Newark metro area.
That’s right, aside from a ten-mile stretch of I-94 in Chicago (which placed second), 2020’s five most congested trucking corridors were in the same metro area.
New York, New York.
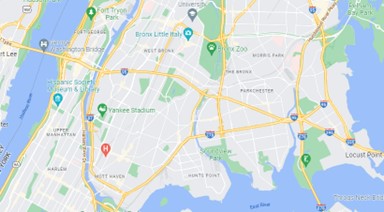
I-95/I-295, New York-Newark
Coming in at first was an eight mile stretch of I-95 and I-295 straddling right along the New York and New Jersey border. I-278 and I-678 (bypass highways around New York City) to the New Jersey side of the infamously congested George Washington Bridge was directly noted in the FHA’s analysis.
Our winner, or maybe loser, saw 234,370 hours in delays which cost more than $60 million in 2020.
Final Thoughts
I-278, I-678, and I-495 were the other New York interstates that received top five honors. All things considered, it makes sense that America’s largest city would have the lion’s share of congestion. Given that all these stretches of interstate are in each other’s proximity as well it’s not too surprising that the data would be in a similar ballpark.
And, after reviewing this data, our experts at Commerce Express Inc. are more thankful of our relatively moderate traffic in the Minneapolis-St. Paul area.
Contact one of our team members if you have any questions regarding this topic or any others in domestic logistics.
This is an everchanging industry. Stay current on rail and trucking developments with our weekly Road Map Newsletter.

Recent Comments